Construction Intelligence
Unincorporated San Diego County records 30 percent fewer permitted homes in first-half snapshot
County dashboard shows 318 housing units permitted in January–June 2026 versus 455 a year earlier. Review the July snapshot, ADU mix and limits.
Unincorporated San Diego County records 30 percent fewer permitted homes in first-half snapshot
January to June 2026 snapshot | Checked October 20, 2026
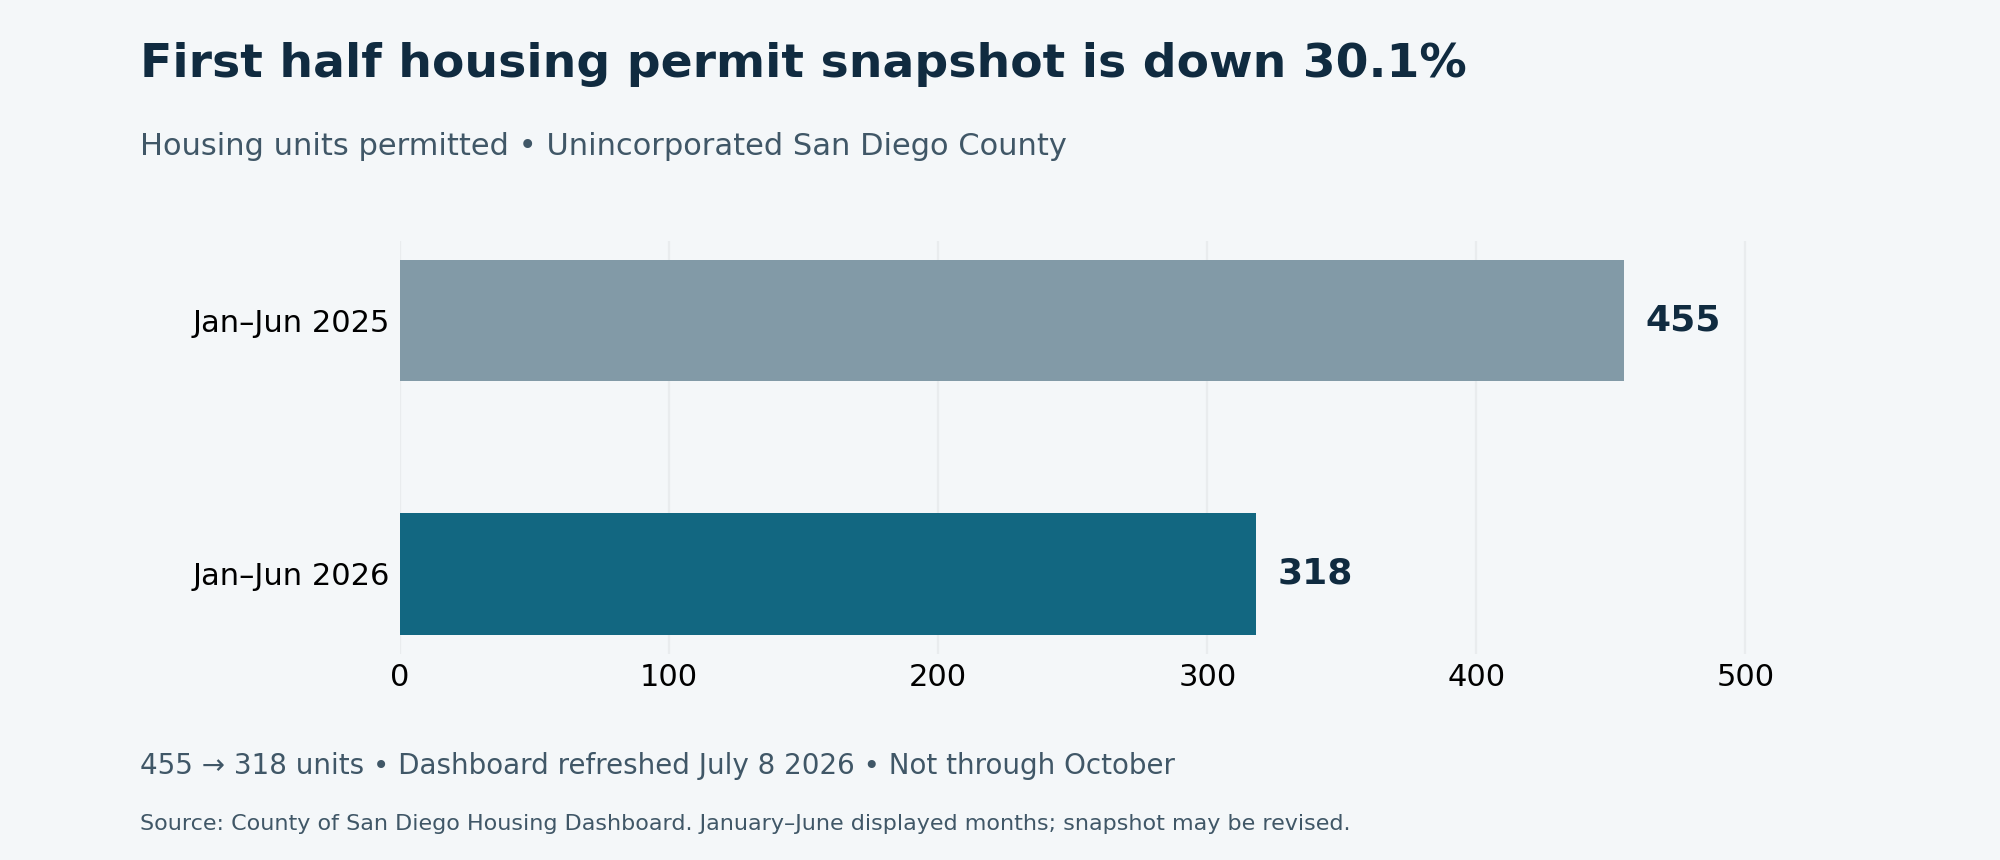
Housing units permitted in the displayed January–June months: 455 in 2025 and 318 in 2026. Unincorporated San Diego County only. Original BuildDetect chart from the County Housing Dashboard, refreshed July 8, 2026; checked October 20, 2026. Snapshot may be revised and is not activity through October.
Unincorporated San Diego County recorded 318 permitted housing units in the January–June months displayed for 2026, compared with 455 in the same months of 2025. The 137-unit difference represents a decline of 30.1%, according to BuildDetect’s calculation from the County’s official housing dashboard. County housing dashboard
This is the latest published snapshot checked for this article, not a count through October 20. The dashboard shows a July 8, 2026 refresh date and describes its figures as a dynamic snapshot updated quarterly. Its 2026 chart currently extends through June; the dashboard does not provide a separate assurance that all June records are complete.
Compare the same months and jurisdiction
The comparison is limited to the County’s unincorporated jurisdiction. It excludes incorporated cities such as San Diego and Chula Vista, and it should not be presented as a regionwide construction index.
BuildDetect summed the dashboard’s January through June values for both years, with all supervisorial districts and housing types selected. That keeps the time window consistent. Comparing the 318 units shown for 2026 with the full 2025 total would exaggerate the decline by placing six displayed months beside twelve.
The monthly pattern also adds context. Every displayed 2026 month except June was below its 2025 counterpart. April showed the largest difference, with 57 units versus 116. June rose to 66 from 59. The aggregate comparison therefore describes a lower first-half total, not an uninterrupted month-by-month slide. County dashboard monthly figures
ADUs account for most of the displayed units
The 2026 snapshot assigns 196 units to its ADU category, 90 to single-family detached housing and 32 to mobile or manufactured homes. The ADU category represents 61.6% of the 318-unit total. County methodology includes attached and detached ADUs as well as junior ADUs in that category.
That mix is useful for contractors deciding where to focus project research. A market total dominated by smaller residential additions can point toward different estimating and staffing needs from a pipeline concentrated in large multifamily buildings. The figures do not identify the size of any available trade package, however, and the ADU share alone does not establish growth in that segment.
A permit signal needs a project check
One larger development can materially affect these unit totals. In the state’s 2025 housing records, 54 units share a single County tracking ID at 528 Alvarado Street in Fallbrook, with an April 17 permit-issuance date. Those rows account for all 54 multifamily units in the first-half ledger, nearly 12% of that period’s 455 units. This illustrates the influence of project size; it does not explain the entire year-over-year decline. HCD annual progress report data
The dashboard counts permitted housing units, not unique projects, starts or open contracts. An issued permit does not establish when work begins or which packages remain available.
For business development, the practical next step is to examine individual records: confirm the location and latest stage, understand the work described, and identify the company responsible for procurement. A declining total does not mean every contractor’s addressable workload is falling at the same rate.
The first-half snapshot gives a more current baseline than the 2025 annual report, while preserving an important limit: it cannot show what happened after June or explain the reasons for the decline. A later dashboard refresh may revise the comparison as additional records are reflected.
See BuildDetect’s San Diego County project and permit guide for jurisdiction and project-stage context.
Sources
- County housing data and insights page; unincorporated geography and official dashboard link. Checked October 20.
- Official County Housing Dashboard, Permitted Housing Units; filters 2026 and 2025 separately, all districts and housing types. Live checked October 20; refresh still July 8.
- HCD 2025 Table A2 dataset and documentation. Row-level historical reconciliation recorded in original October16 source audit; not represented as a newly downloaded October20 ledger.